AMGeO News

AMGeO Release 3.0
Get the latest sourceMay 24, 2023
A docker image of AMGeO is now available with a tutorial and jupyter lab pre-installed! In addition, AMGeO can now produce TIEGCM input files and save observational data for the user. Finally, we have added the ability to turn on and off SuperDARN observational data assimilation.

AMGeO CEDAR Workshop
The github repositoryJune 25, 2021
Hosted Live Demo of AMGeO software at CEDAR 2021
AMGeO Maps
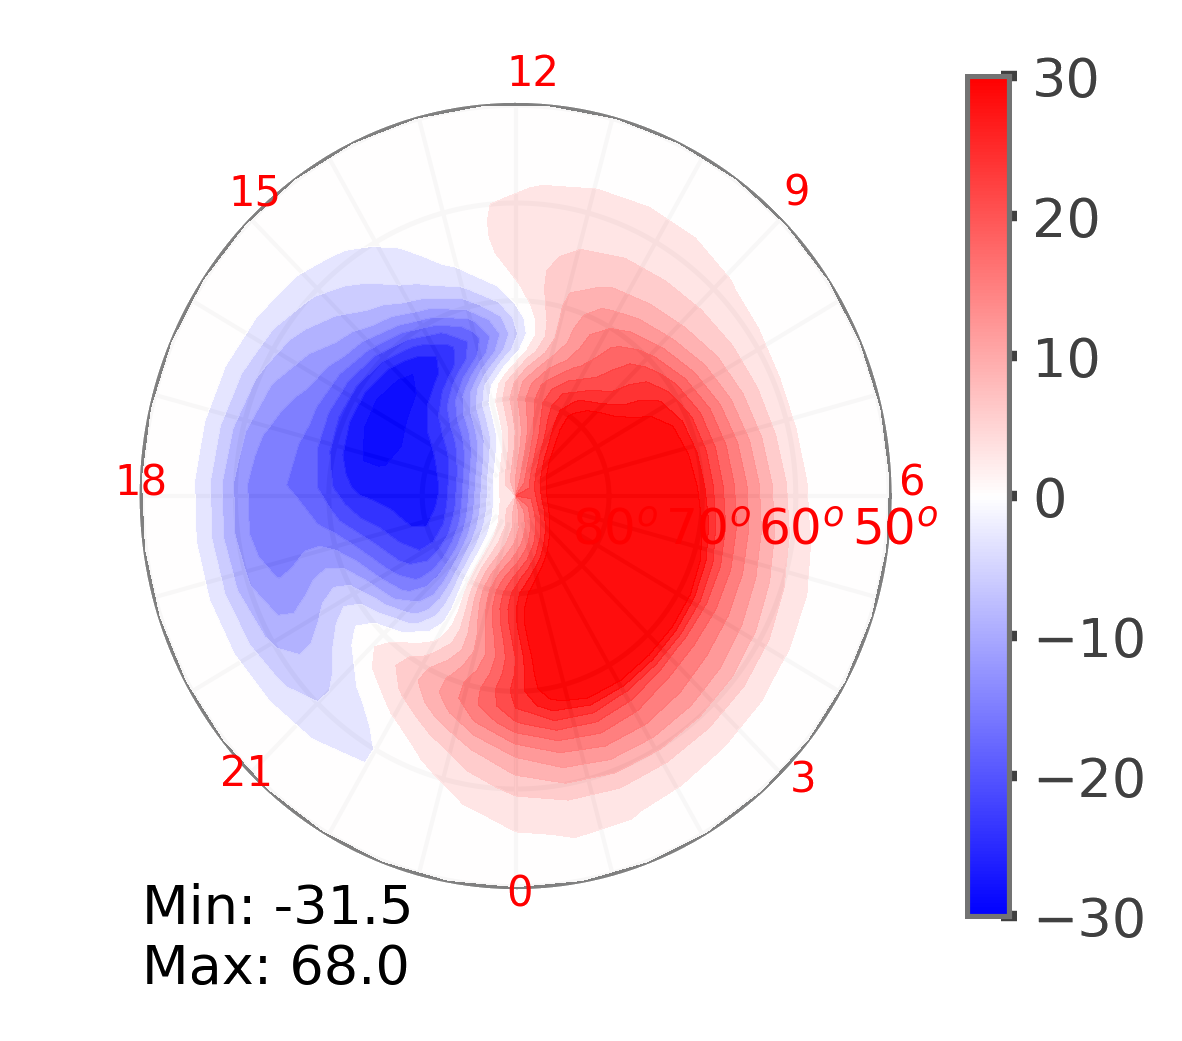
Electrostatic Potential
Large-scale electrostatic potential patterns in the Earth's high-latitude ionosphere, shown in mV/m from 90 to 50 magnetic latitudes with the 12 noon local solar time at the top.
The equipotential countour lines track the convective motion of ionospheric plasma in the direction perpendicular to the Earth's main magnetic fields and the electric fields.
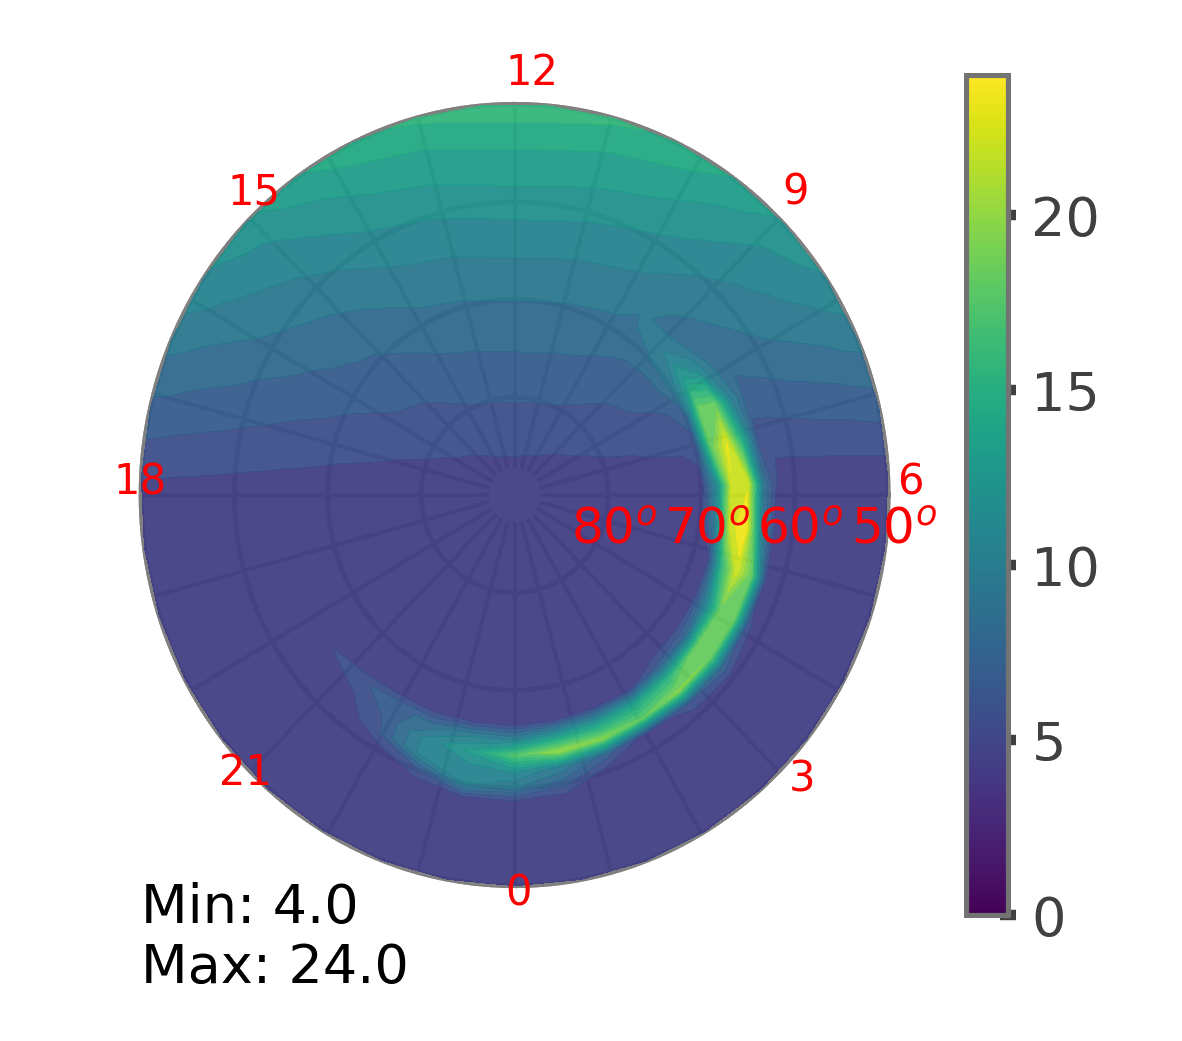
Hall Conductance
Hall electric conductance patterns in the Earth's high-latitude ionosphere, shown in siemens from 90 to 50 magnetic latitudes with the 12 noon local solar time at the top.
The Hall conductance is the height-integrated ionospheric conductivity in the direction perpendicular to both magnetic and electric fields.
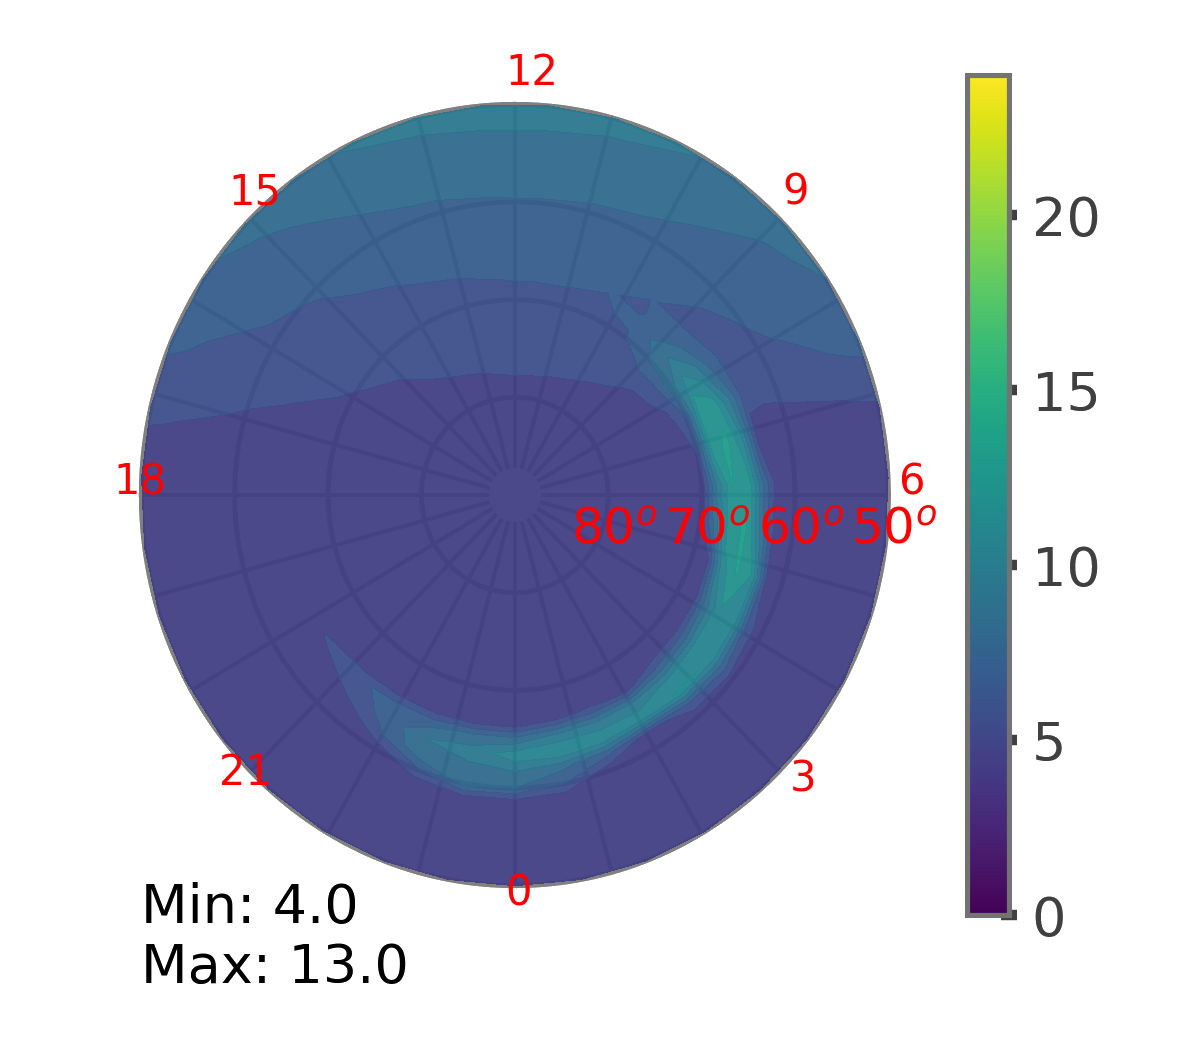
Pedersen Conductance
Pedersen electric conductance patterns in the Earth's high-latitude ionosphere, shown in siemens from 90 to 50 magnetic latitudes with the 12 noon local solar time at the top.
The Pedersen conductance is the height-integrated ionospheric conductivity in the direction perpendicular to magnetic fields but parallel to electric fields.
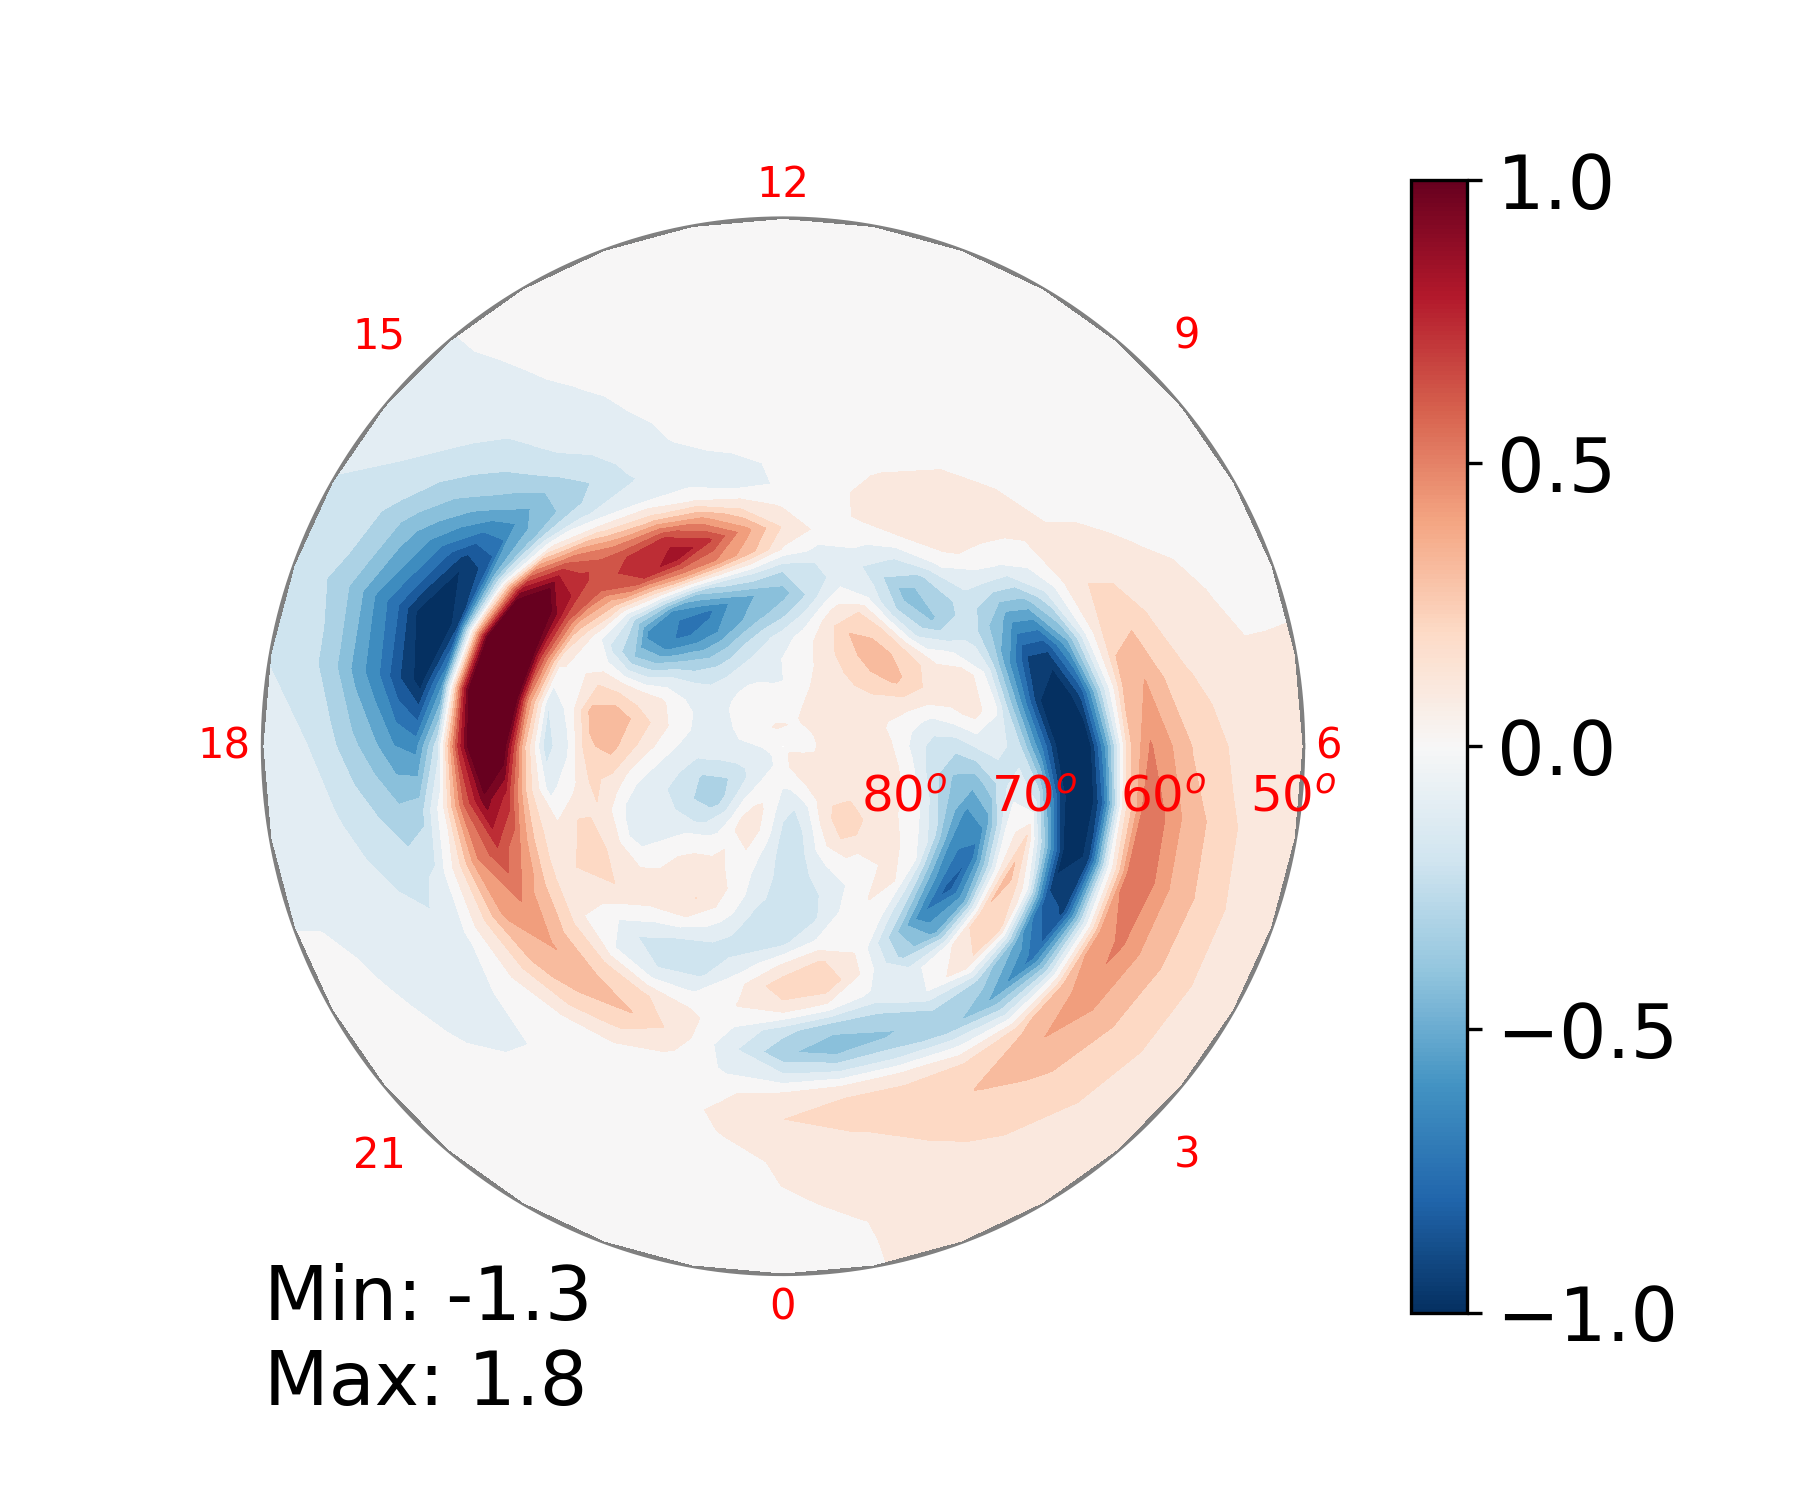
Field-Aligned Current
Field-aligned current density patterns in the Earth's high-latitude ionosphere, shown in uA/m from 90 to 50 magnetic latitudes with the 12 noon local solar time at the top.
Field-aligned currents flow into and out of the ionosphere, electrically connecting it to the magnetosphere.
Making AMGeO Maps
Prior Model
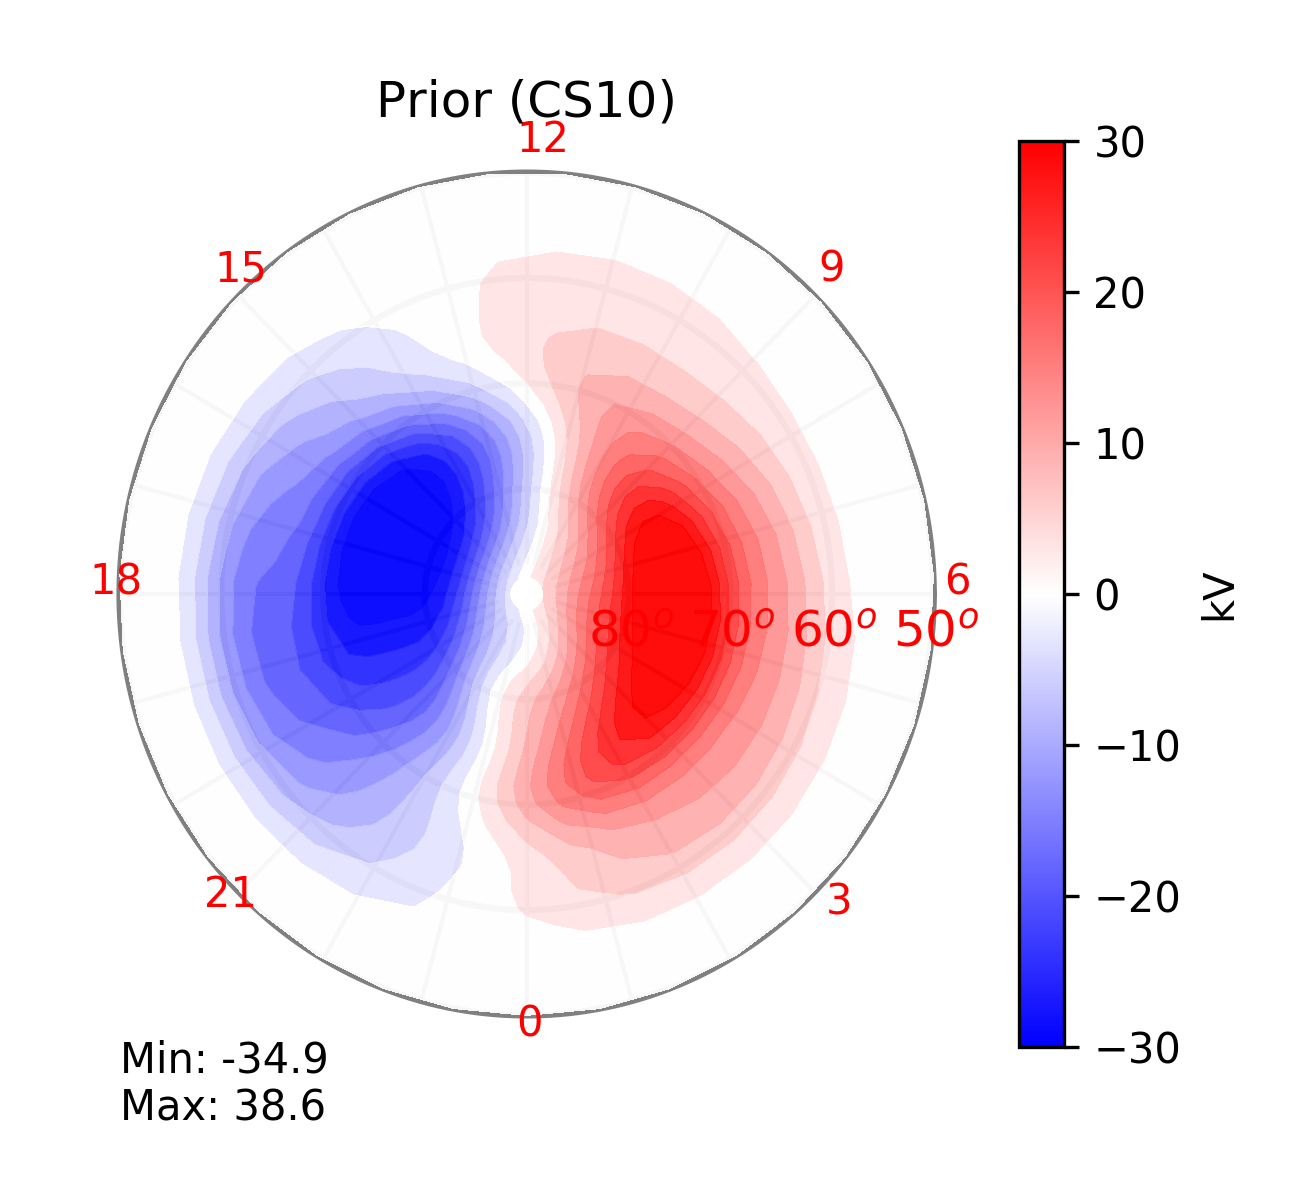
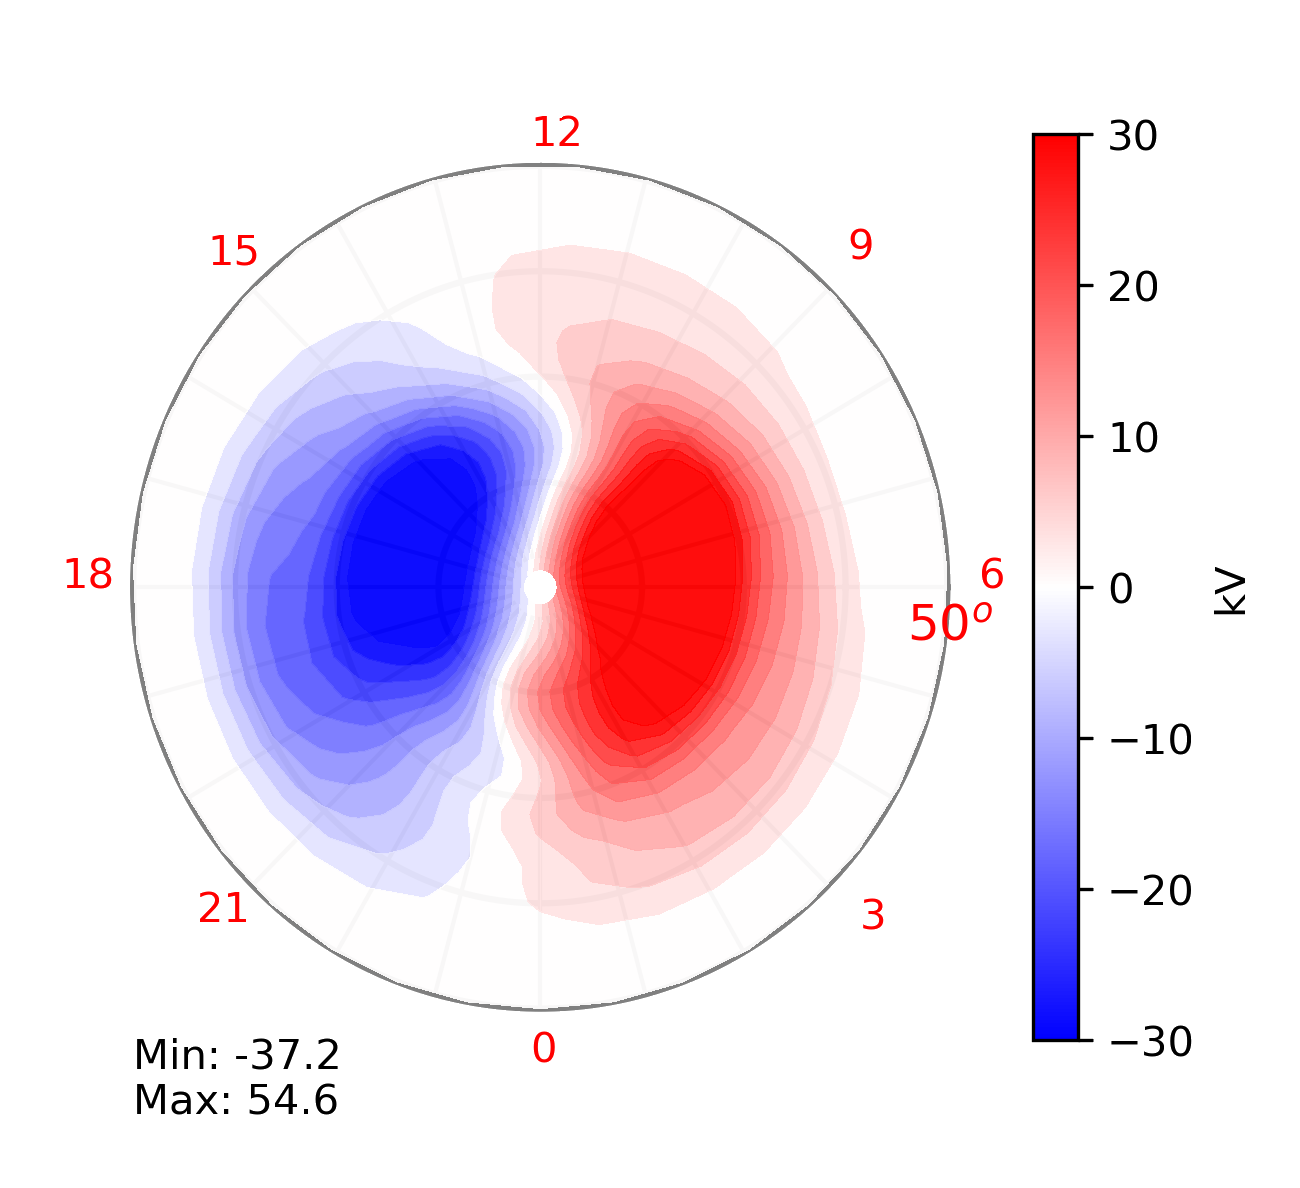
AMGeO combines the prior information of high - latitude ionospheric electrodynamic variables with multiple types of observations according to Bayes' rule. Under the Gaussian process assumption, AMGeO's solution for the posterior distribution is given by Kalman filter measurement update equations.
The prior distribution is specified by the prior mean (above) and covariance.The prior covariance is less known but plays an important role in balancing weights of the prior mean and observations and spreading the observation information into data-void areas.
In AMGeO, the prior mean for electrostatic potential patterns is specified by an empirical model developed by Cousins and Shephard (JGR, 2010). Just like this prior mean model, the prior covariance model was developed using a large volume of SuperDARN data (Cousins, Matsuo and Richmond, JGR, 2013).
Data Impact
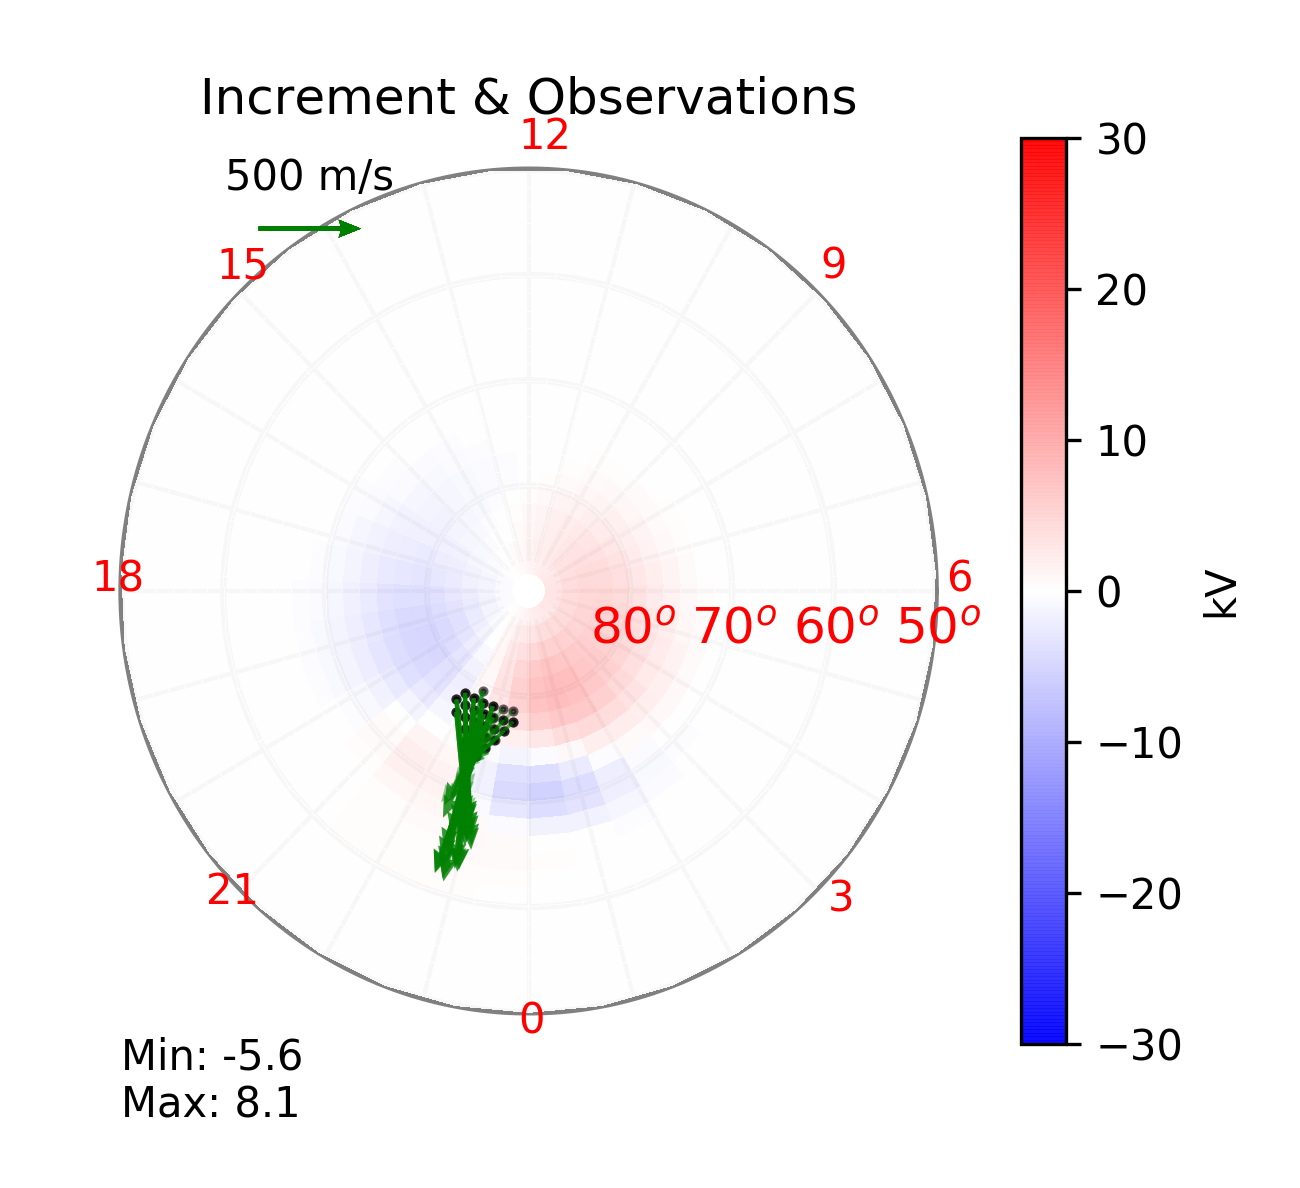
When AMGeO assimilates plasma drift measurements from SuperDARN, it computes the discrepancy between what is observed and what is predicted by the prior mean model of electrostatic potential. This discrepancy is called the innovation. The innovation is transformed into electrostatic potential analysis increments using the physical relationship between plasma drifts and electrostatic potential, the prior model covariance, and the observational error covariance.
The plot above displays SuperDARN plasma drifts from the Rankin Inlet radar (in green arrows) and analysis increments (in color contours) due to these SuperDARN observations for 09:40 Universal Time on 05-29-2010. The analysis increments are the contributions of SuperDARN data in electrostatic potential to the AMGeO Map.
The AMGeO software and AMGeO web application services facilitate the data acquisition and pre-processing of plasma drift data distributed from SuperDARN, the SuperDARN Website. The AMGeO software is designed to use the SuperDARN grid2 data product. The grid2 data availability can be found on SuperDARN, the SuperDARN Data Inventory Site.
AMGeO Map
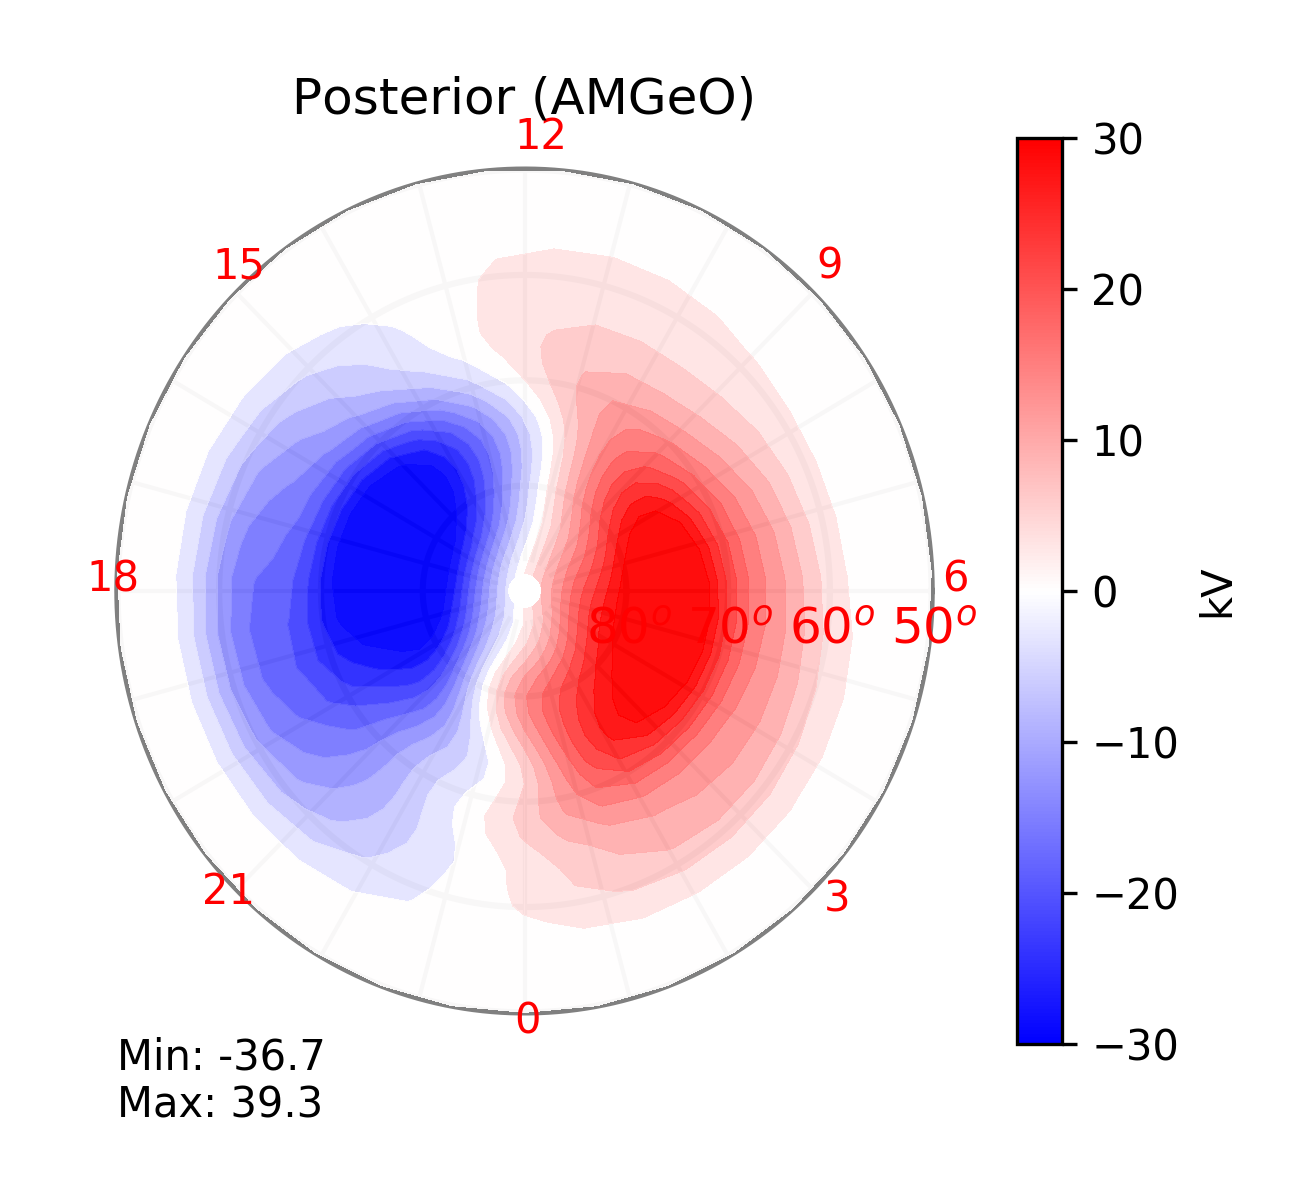
The AMGeO Map is the posterior mean resulting from Bayesian analysis of high-latitude ionospheric electrodynamic variables, which is obtained by adding up the analysis increments from all observations with the prior mean. AMGeO also computes the posterior covariance. The posterior variance helps determine the uncertainty of the AMGeO Map at each location.
The plot displays the AMGeO Map resulting from assimilation of SuperDARN plasma drift data as shown above.
Prior Model
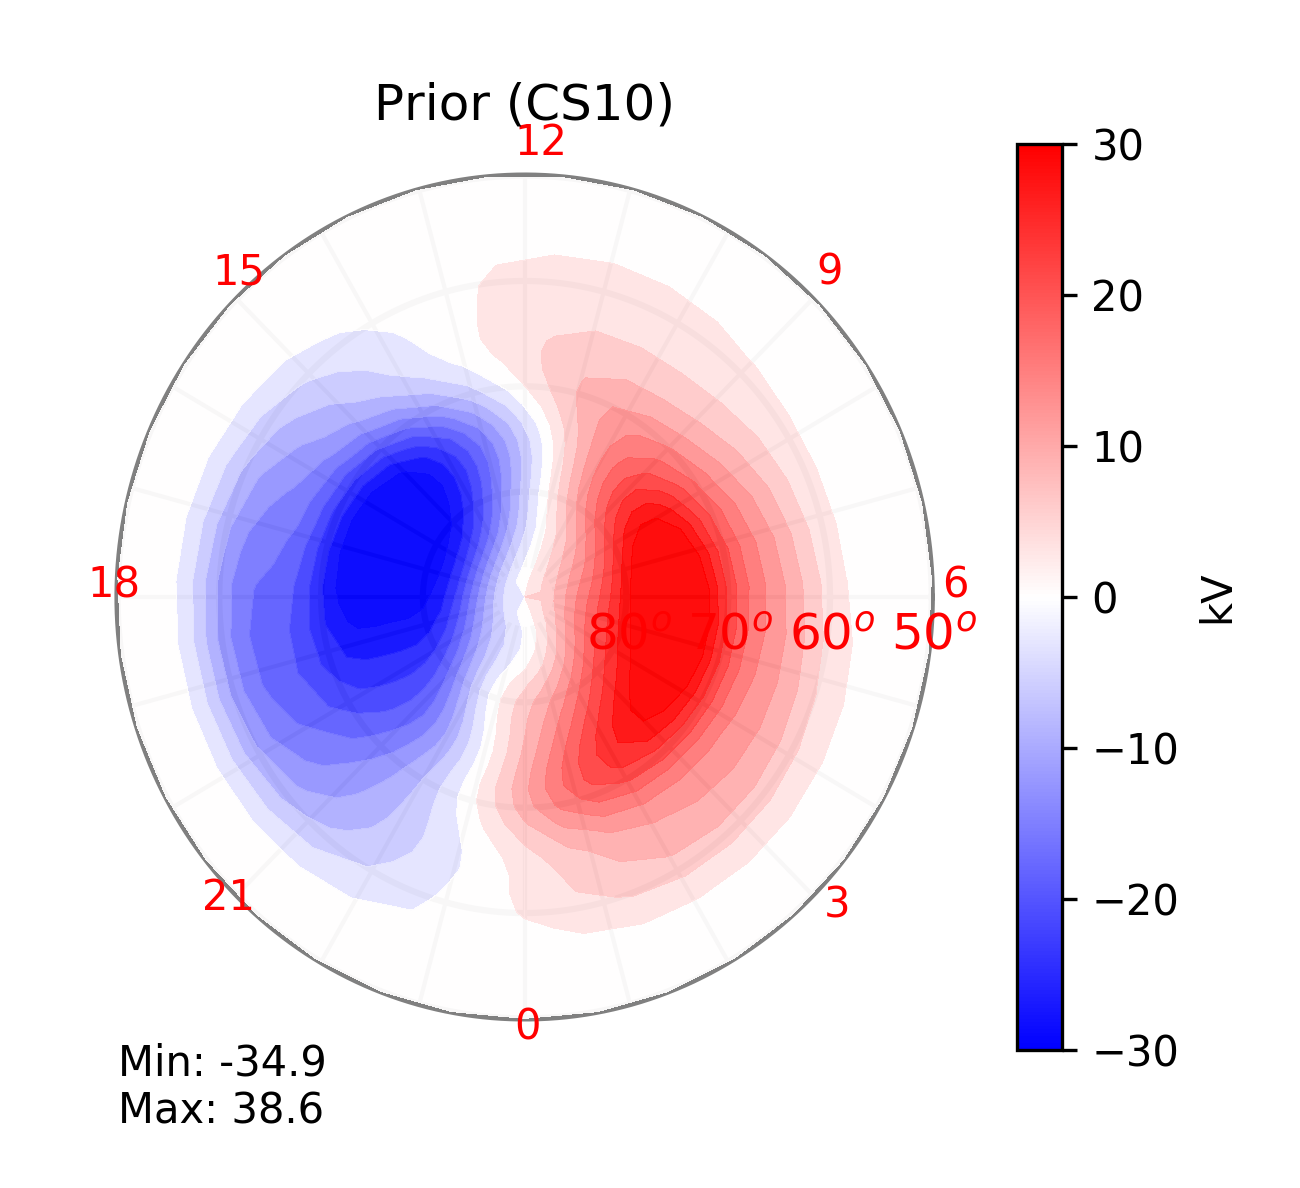
AMGeO combines the prior information of high - latitude ionospheric electrodynamic variables with multiple types of observations according to Bayes' rule. Under the Gaussian process assumption, AMGeO's solution for the posterior distribution is given by Kalman filter measurement update equations.
The prior distribution is specified by the prior mean (above) and covariance.The prior covariance is less known but plays an important role in balancing weights of the prior mean and observations and spreading the observation information into data-void areas.
In AMGeO, the prior mean for electrostatic potential patterns is specified by an empirical model developed by Cousins and Shephard (JGR, 2010). Just like this prior mean model, the prior covariance model was developed using a large volume of SuperDARN data (Cousins, Matsuo and Richmond, JGR, 2013).
Data Impact
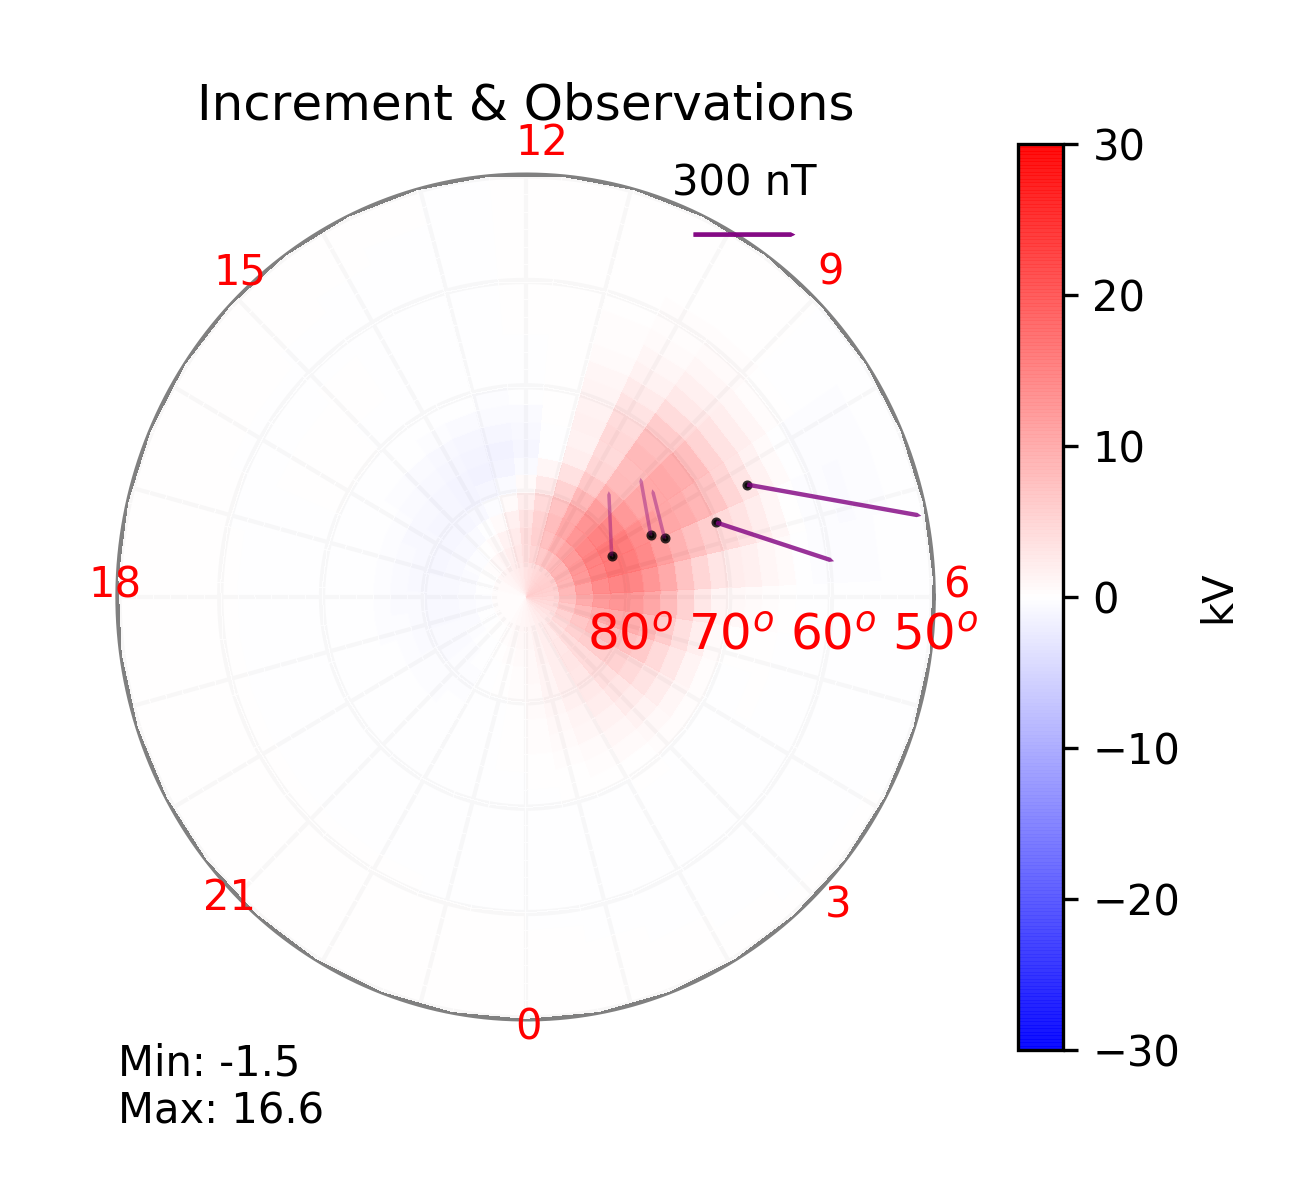
When AMGeO assimilates ground-level magnetic fields measurements, AMGeO computes the discrepancy between what is observed and what is predicted ground-level magnetic fields by the prior mean models of electrostatic potential and ionospheric conductivity. This discrepancy is called the innovation. The innovation is transformed into electrostatic potential analysis increments using the physical relationship between ground-level magnetic fields and electrostatic potential, the prior model covariance, and the observational error covariance.
The plot above displays magnetic field perturbations due to ionospheric currents at five Greenland magnetometer stations (in purple bars) and analysis increments (in color contours) for 05-29-2010 09:40 Universal Time. The analysis increments are the contributions of SuperMAG data in electrostatic potential to the AMGeO Map.
The AMGeO software and AMGeO web application services facilitate the data acquisition and pre-processing of ground-based magnetometer data distributed from SuperMAG, the SuperMAG Website. The AMGeO software is designed to use the SuperMAG Baseline Subtracted data product. The SuperMAG data availability can be found on SuperMAG Data, the SuperMAG Magnetometer Data Site.
AMGeO Map
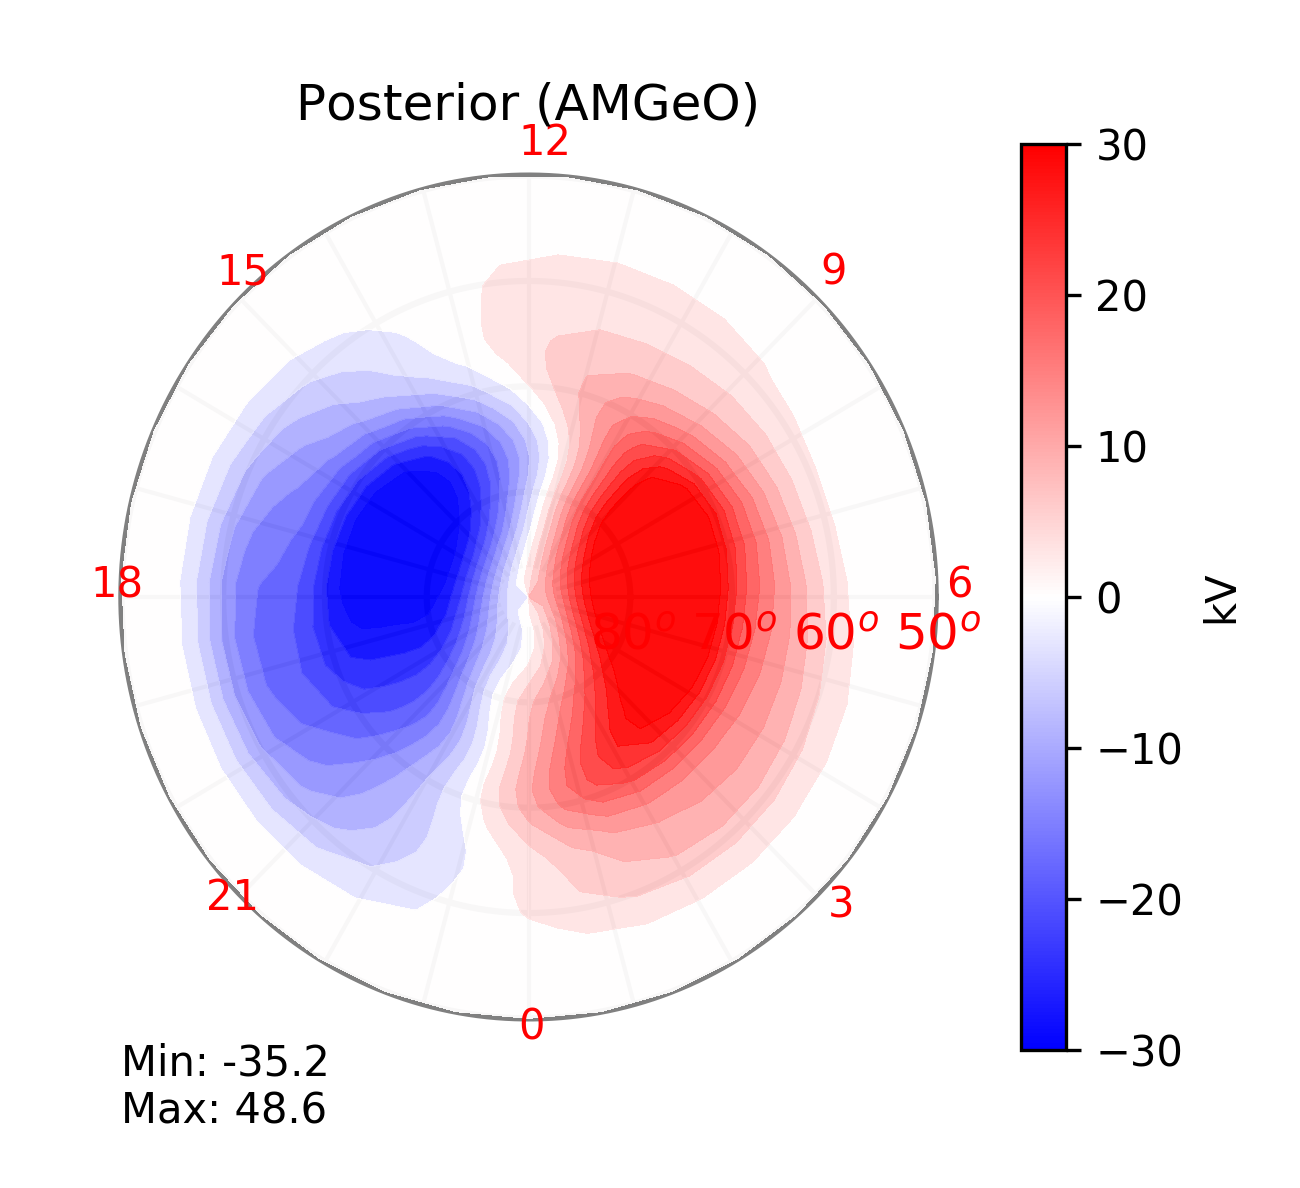
The AMGeO Map is the posterior mean resulting from Bayesian analysis of high-latitude ionospheric electrodynamic variables, which is obtained by adding up the analysis increments from all observations with the prior mean. AMGeO also computes the posterior covariance. The posterior variance helps determine the uncertainty of the AMGeO Map at each location.
The plot displays the AMGeO Map resulting from assimilation of SuperMAG magnetometer data as shown above.
Prior Model
AMGeO combines the prior information of high - latitude ionospheric electrodynamic variables with multiple types of observations according to Bayes' rule. Under the Gaussian process assumption, AMGeO's solution for the posterior distribution is given by Kalman filter measurement update equations.
The prior distribution is specified by the prior mean (above) and covariance.The prior covariance is less known but plays an important role in balancing weights of the prior mean and observations and spreading the observation information into data-void areas.
In AMGeO, the prior mean for electrostatic potential patterns is specified by an empirical model developed by Cousins and Shephard (JGR, 2010). Just like this prior mean model, the prior covariance model was developed using a large volume of SuperDARN data (Cousins, Matsuo and Richmond, JGR, 2013).
Data Impact
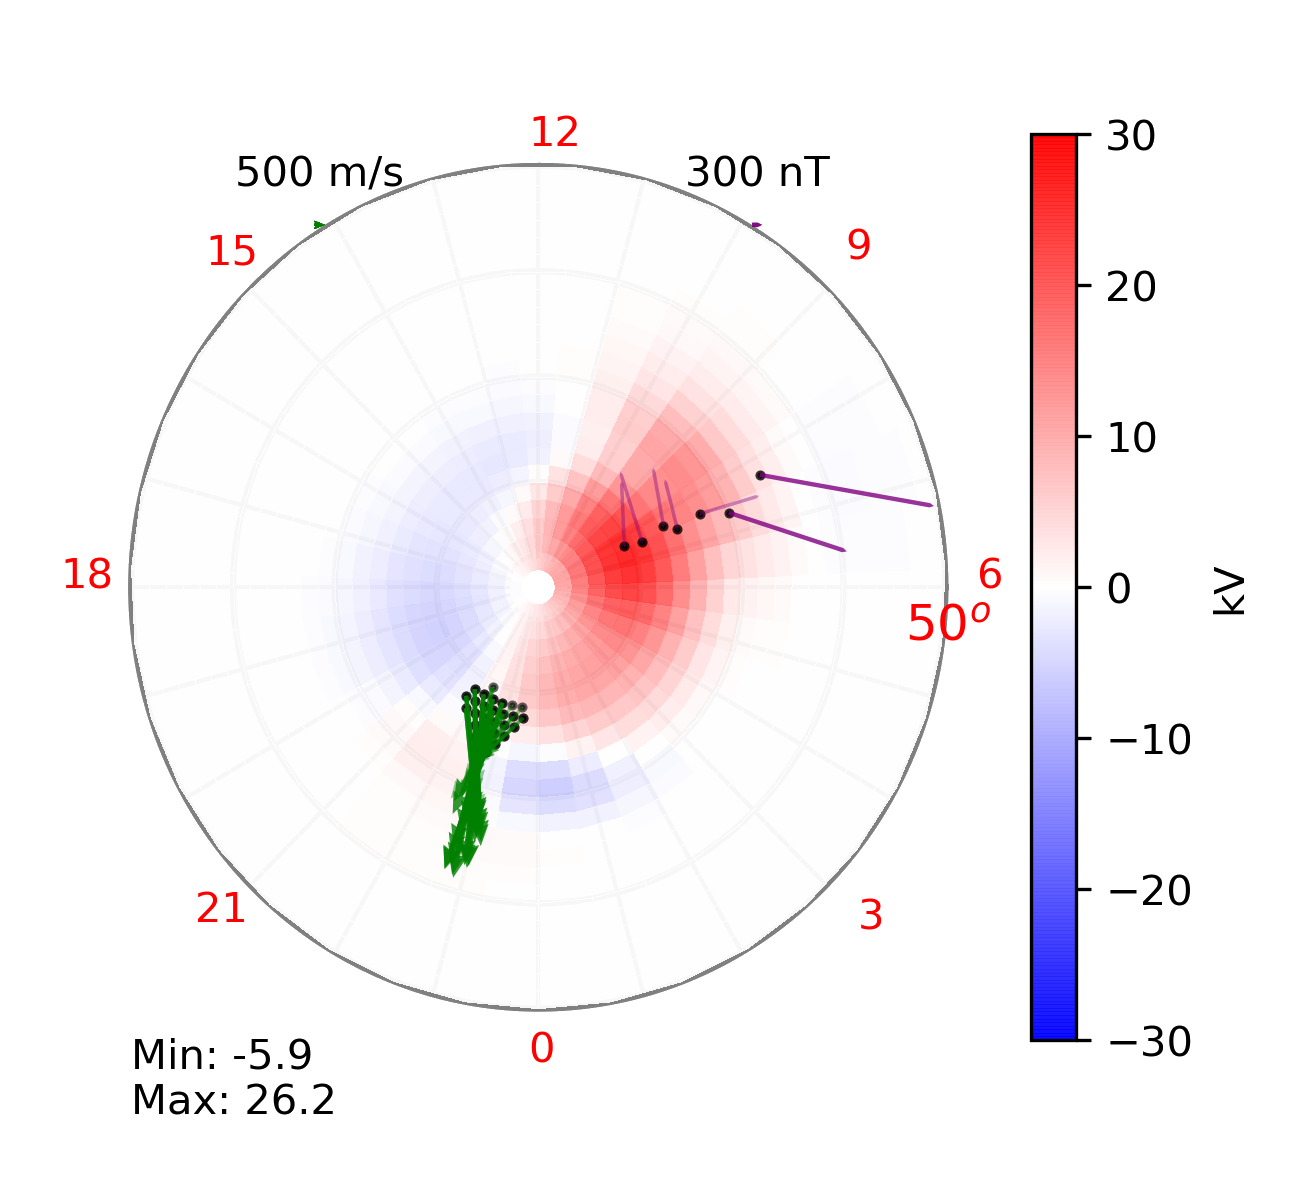
When AMGeO assimilates ground-level magnetic fields and SuperDARN plasma drift measurements, it computes the discrepancy between what are observed and what is predicted by the prior mean models. This discrepancy is called the innovation. The innovation is transformed into electrostatic potential analysis increments using the physical relationship between plasma drifts, ground-level magnetic fields and electrostatic potential, the prior model covariance, and the observational error covariance.
The plot above displays SuperDARN plasma drifts (in green arrows) and magnetic fields obtained from the SuperMAG Data Service (in purple bars) and analysis increments due to these data for 05-29-2010 09:40 Universal Time. The analysis increments are the contributions of SuperDARN and SuperMAG data in electrostatic potential to the AMGeO Map.The AMGeO software and AMGeO web application services facilitate the data acquisition and pre-processing of plasma drift data distributed from SuperDARN, the SuperDARN Website, and ground-based magnetometer data distributed from SuperMAG, the SuperMAG Website.
AMGeO Map
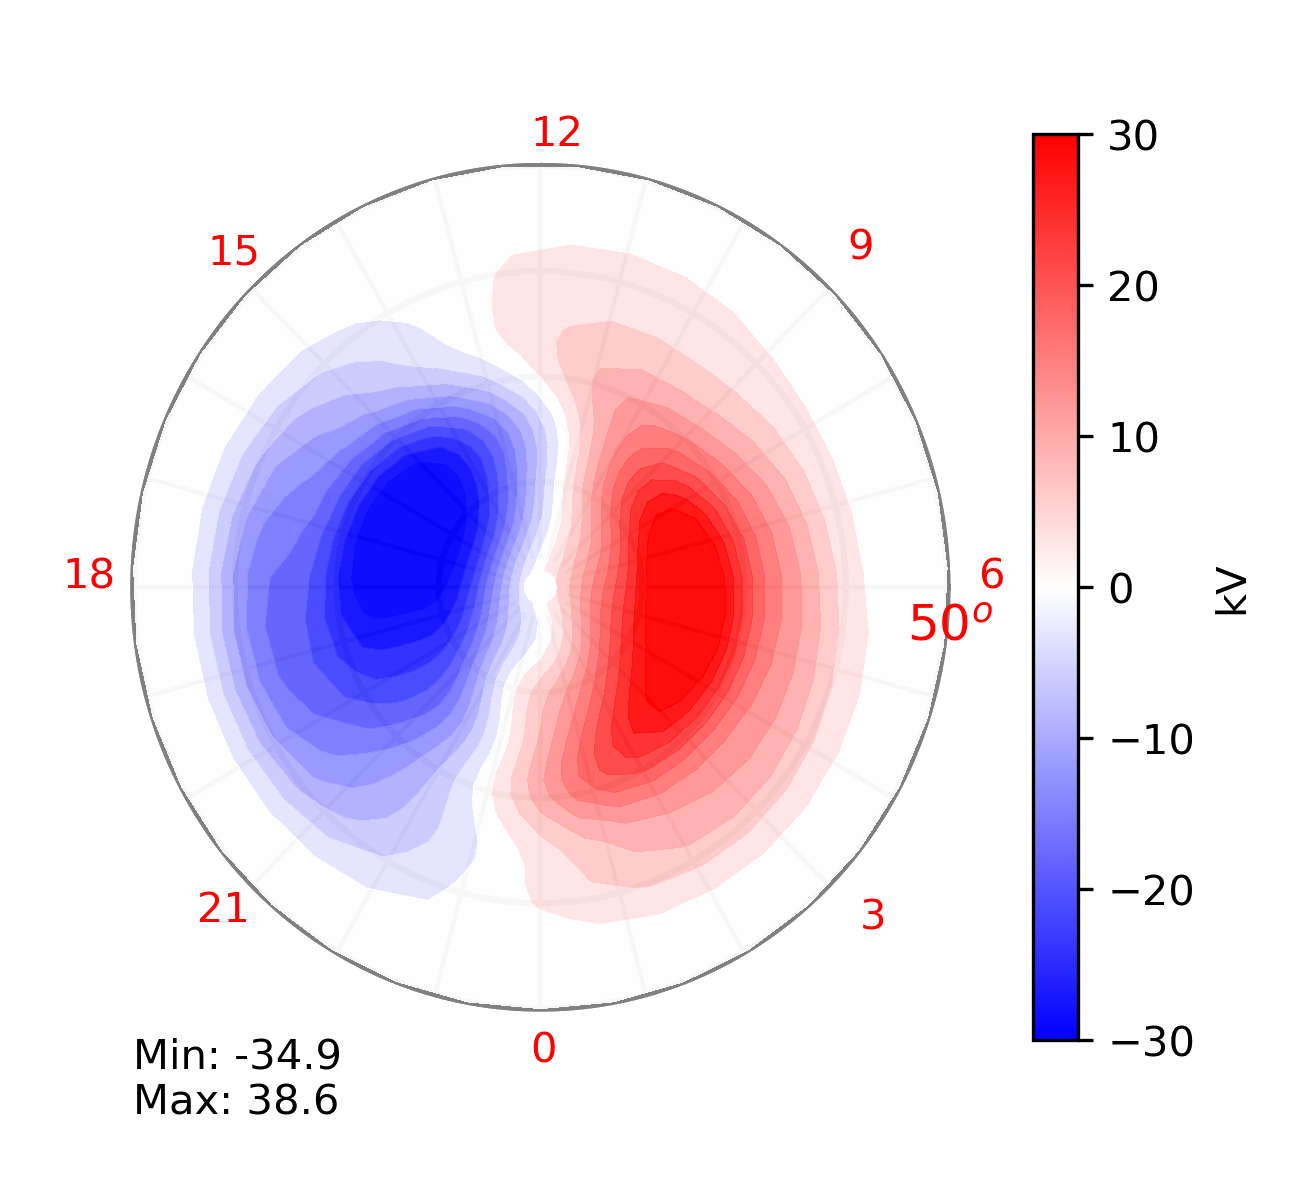
The AMGeO Map is the posterior mean resulting from Bayesian analysis of high-latitude ionospheric electrodynamic variables, which is obtained by adding up the analysis increments from all observations with the prior mean. AMGeO also computes the posterior covariance. The posterior variance helps determine the uncertainty of the AMGeO Map at each location.
The plot displays the AMGeO Map resulting from assimilation of SuperDARN plasma drift and SuperMAG magnetometer data as shown above.
Prior Model
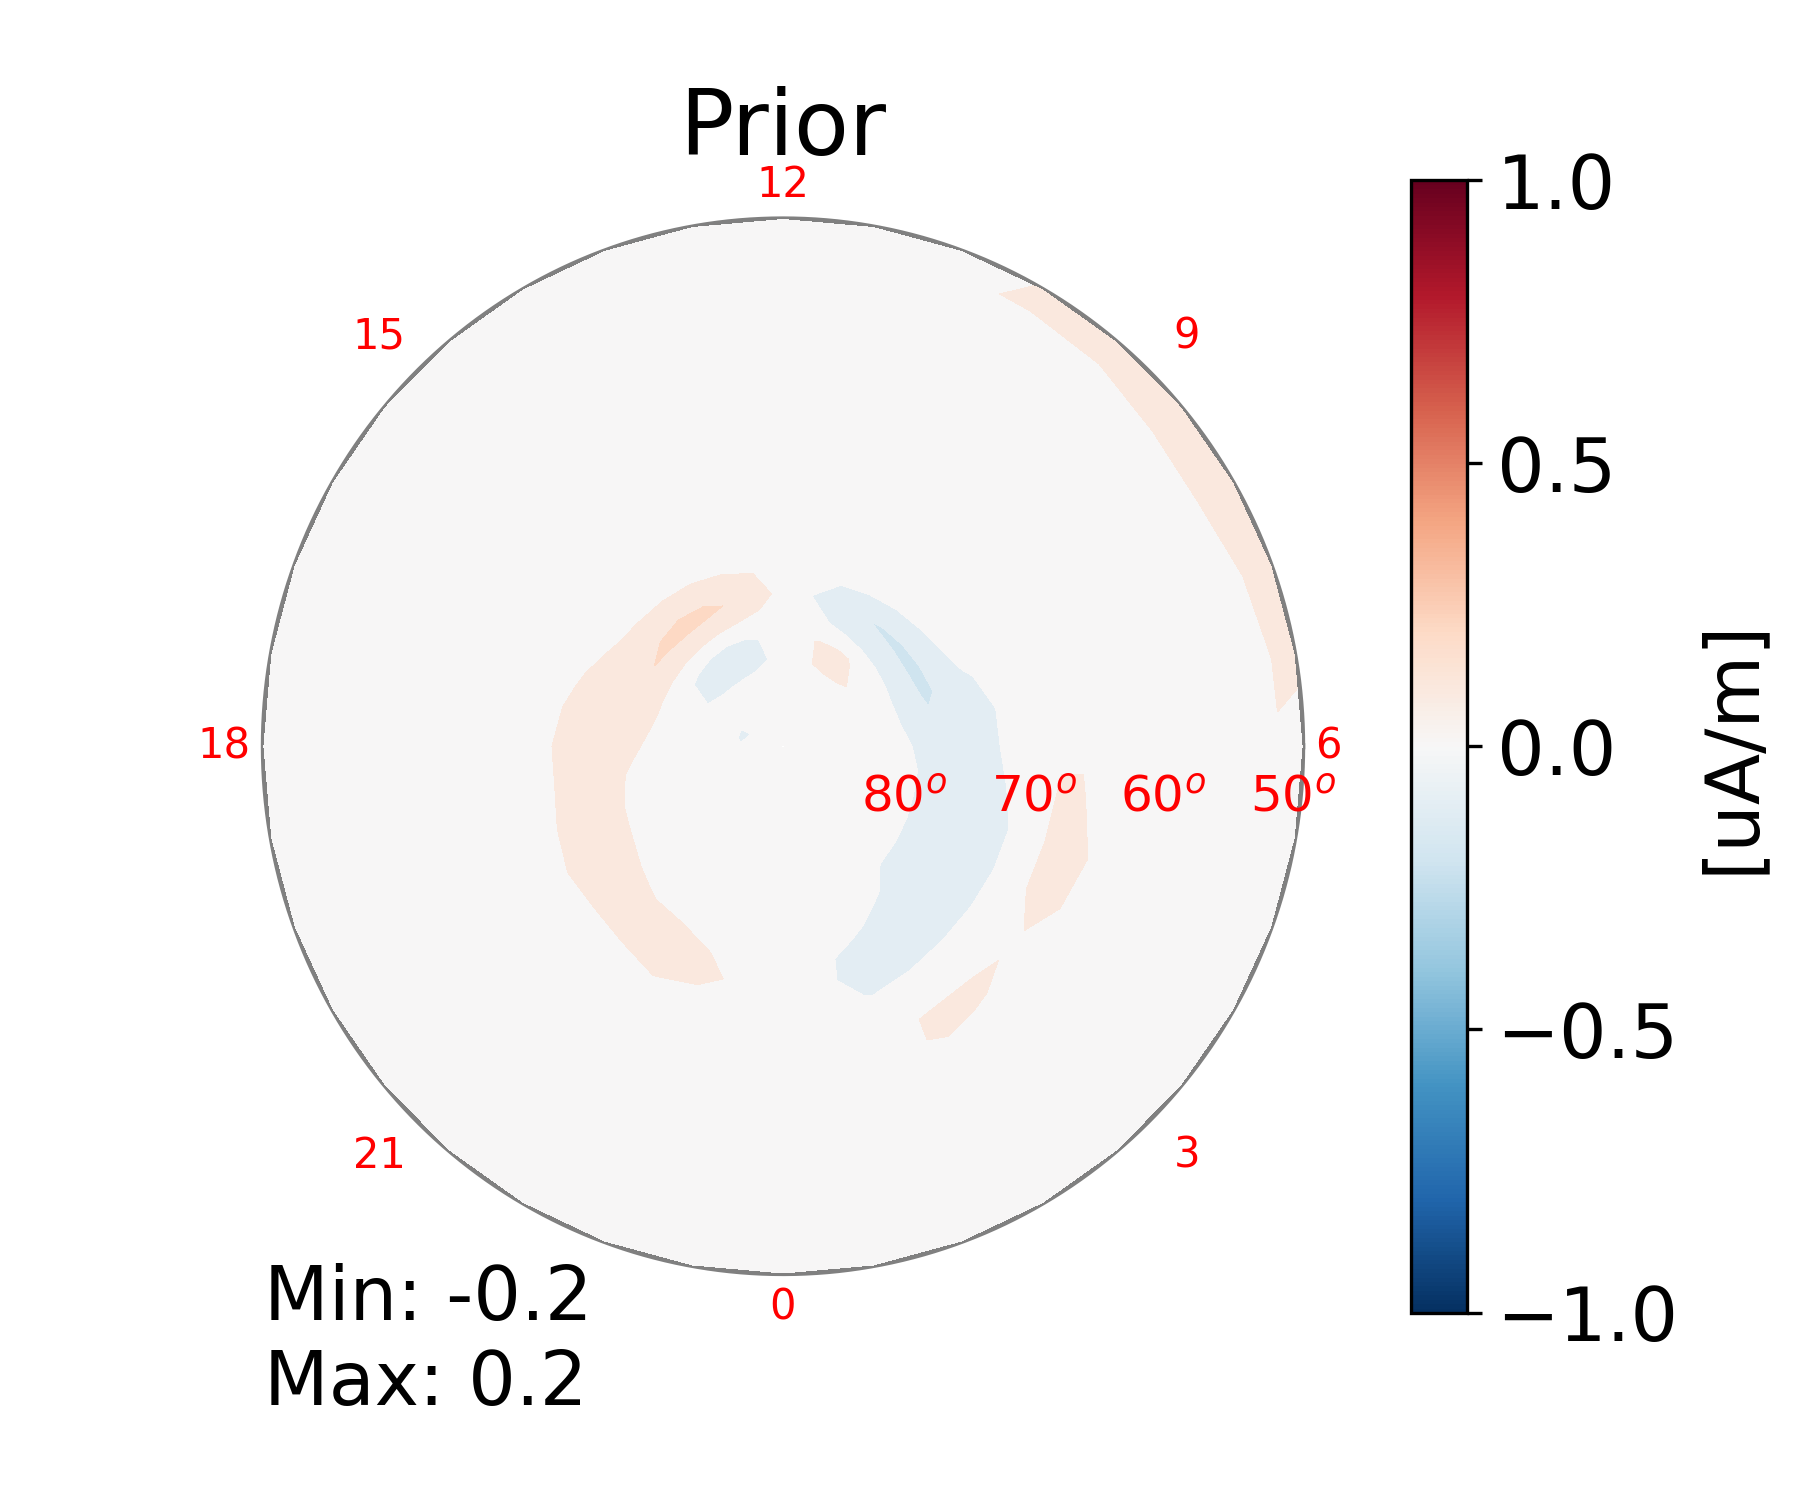
AMGeO combines the prior information of high - latitude ionospheric electrodynamic variables with multiple types of observations according to Bayes' rule. Under the Gaussian process assumption, AMGeO's solution for the posterior distribution is given by Kalman filter measurement update equations.
The prior distribution is specified by the prior mean (above) and covariance.The prior covariance is less known but plays an important role in balancing weights of the prior mean and observations and spreading the observation information into data-void areas.
In AMGeO, the prior mean and prior covariance models for field-aligned currents are specified by applying empirical orthogonal function analysis to Iridium data (e.g. Matsuo et al. 2015)
Data Impact
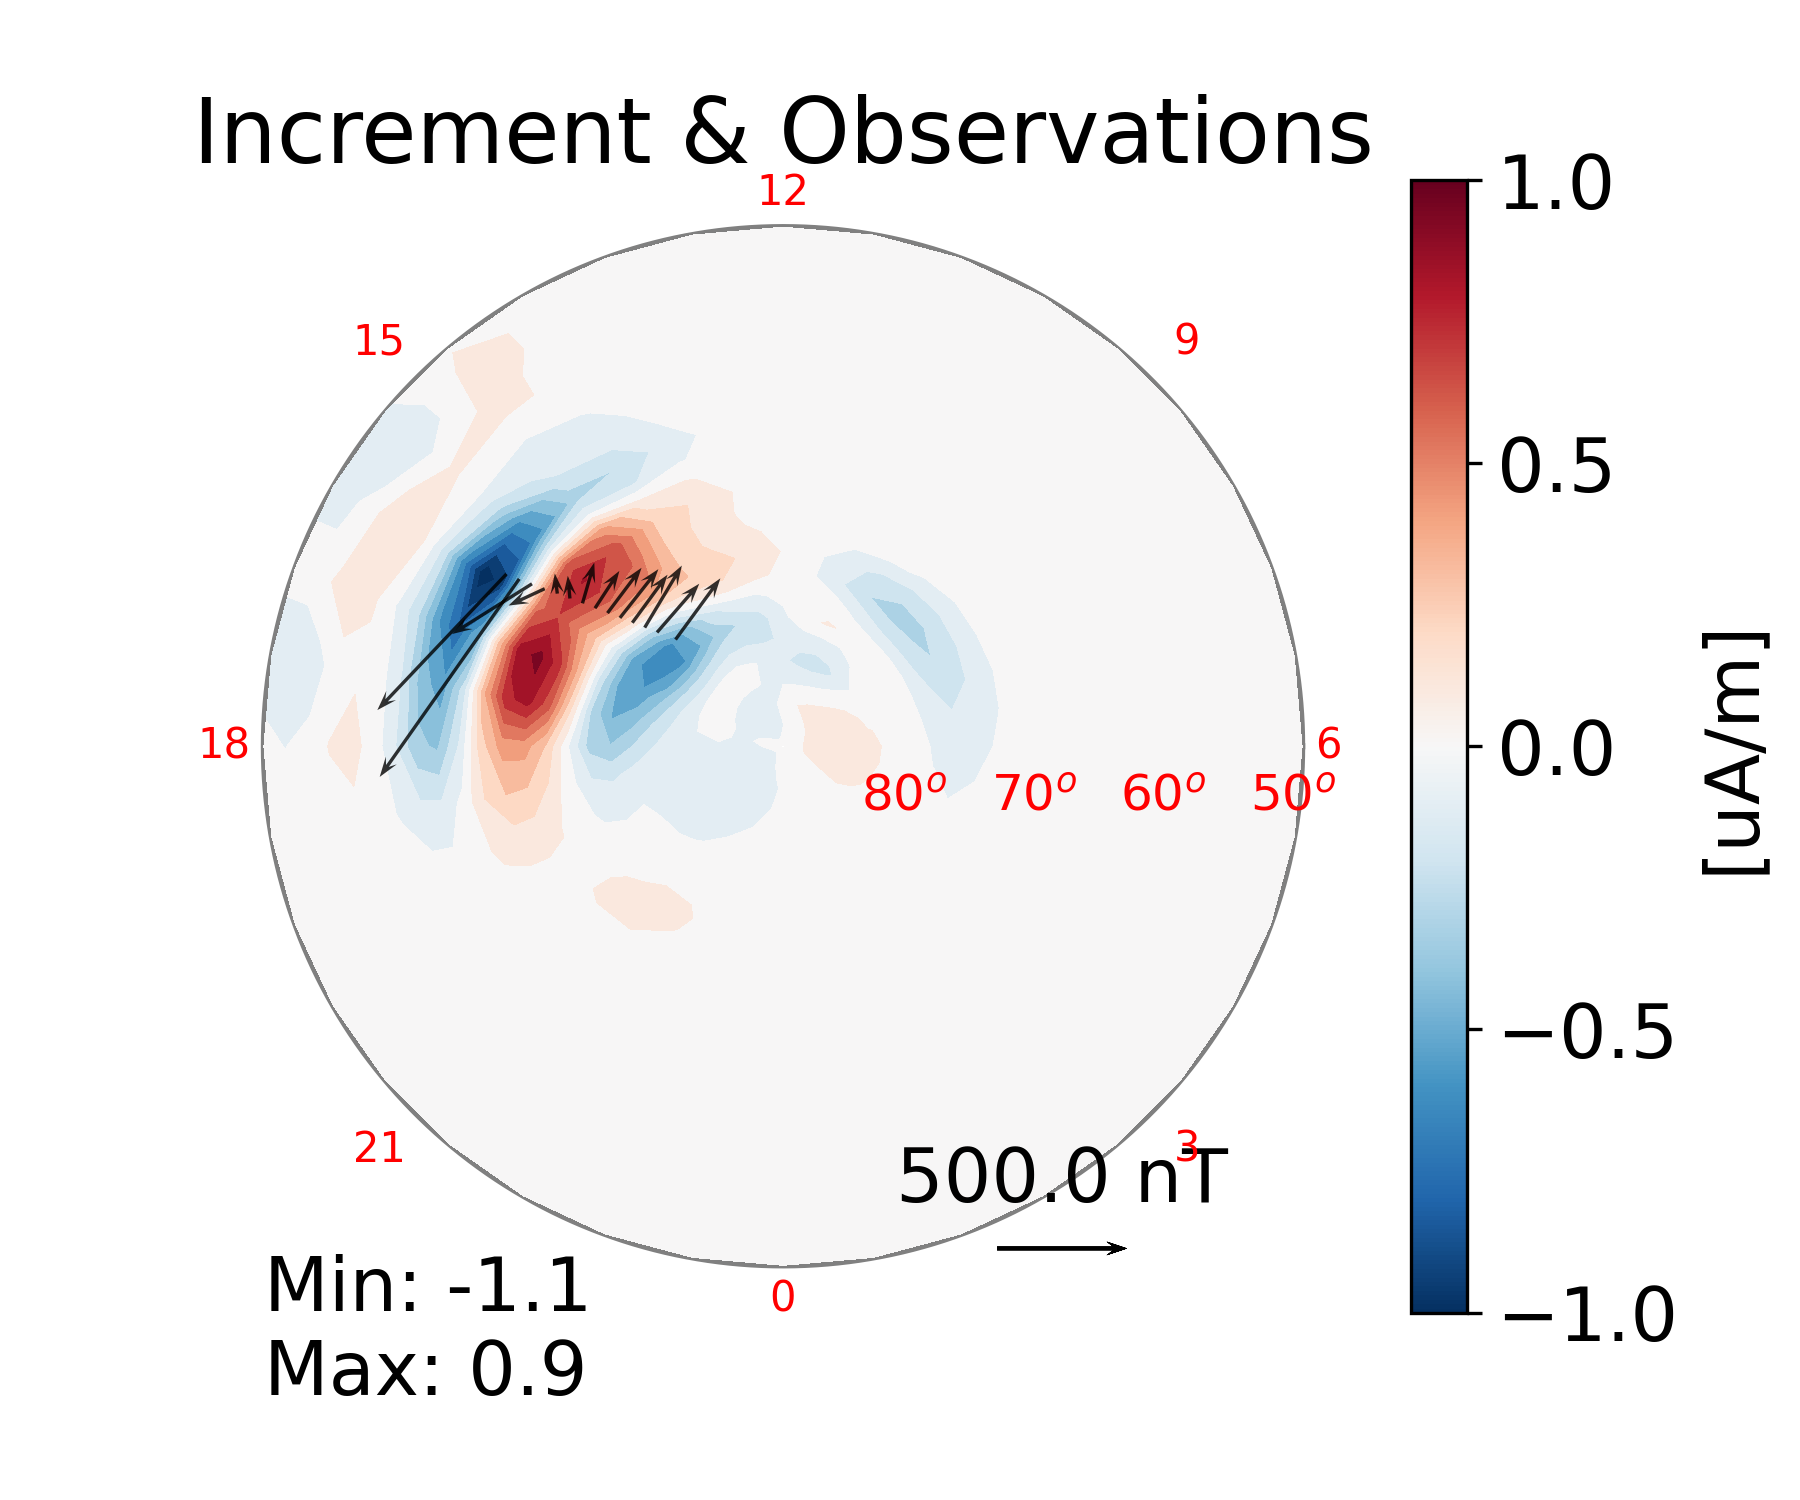
When AMGeO assimilates magnetic field measurements made by Iridium spacecraft, it computes the discrepancy between what are observed and what is predicted by the prior mean models. This discrepancy is called the innovation. The innovation is transformed into field-aligned current analysis increments using the physical relationship between magnetic perturbations and toroidal magnetic potential, the prior model covariance, and the observational error covariance.
The plot above displays Iridium magnetic perturbations (changes in the geomagnetic field induced by currents flowing into and out of the ionosphere) in black, and analysis increments due to these data for 05-29-2010 09:40 Universal Time. The analysis increments are the contributions of the data to the field aligned current AMGeO map.The AMGeO software and AMGeO web application services enable automated access to the Iridium magnetometer data distributed from AMPERE.
AMGeO Map
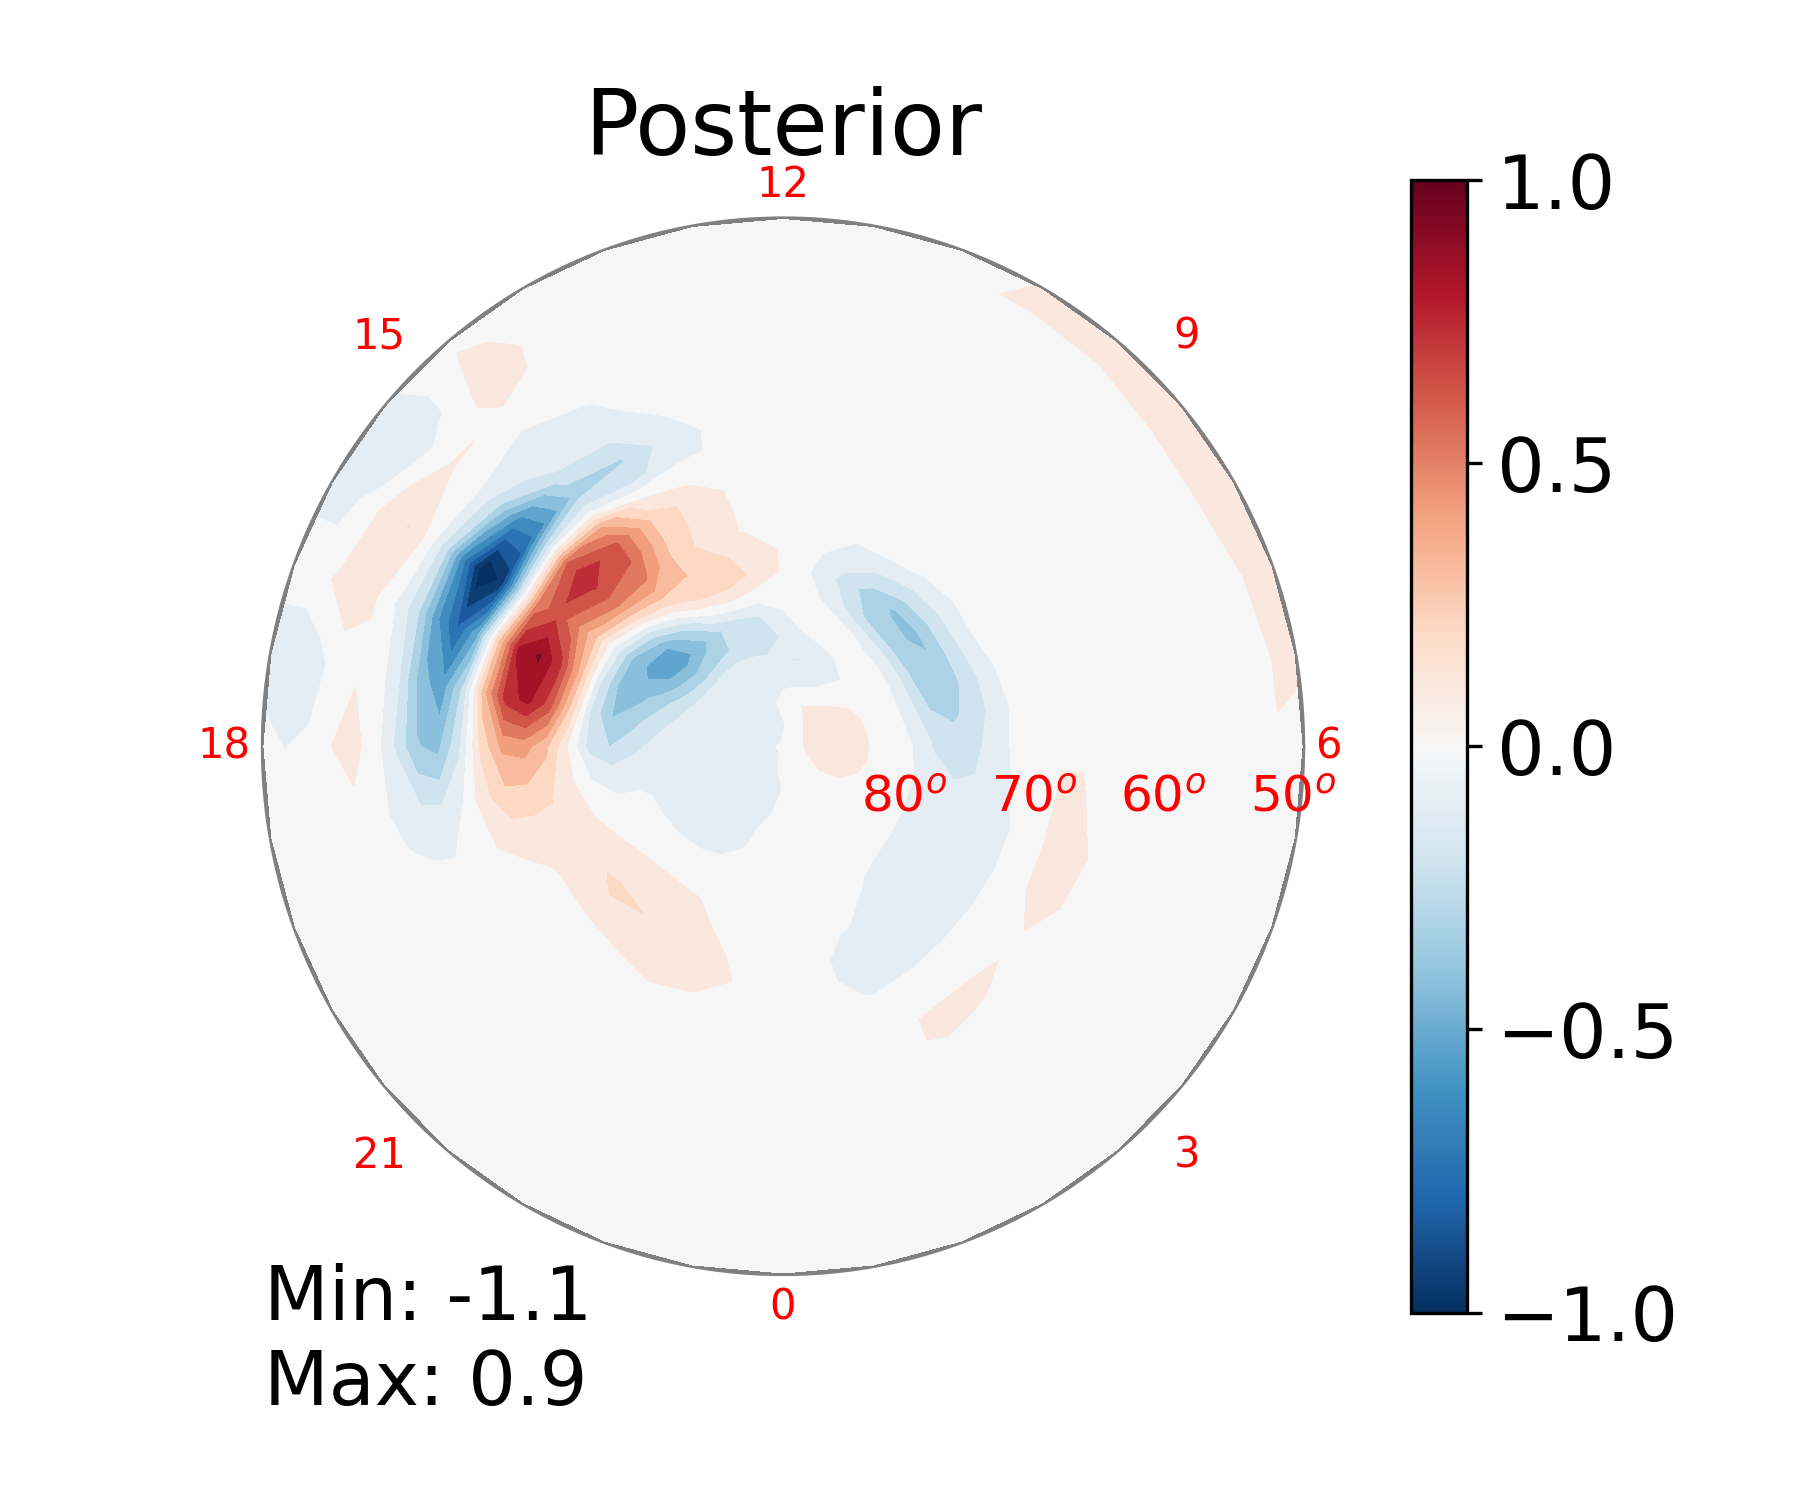
The AMGeO Map is the posterior mean resulting from Bayesian analysis of high-latitude ionospheric electrodynamic variables, which is obtained by adding up the analysis increments from all observations with the prior mean. AMGeO also computes the posterior covariance. The posterior variance helps determine the uncertainty of the AMGeO Map at each location.
The plot displays the AMGeO Map resulting from assimilation of Iridium magnetic field data as shown above.


